


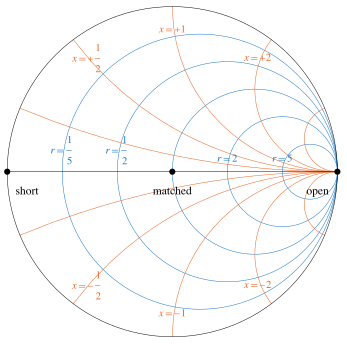
A Smith chart is a circular coordinate diagram used in radio-frequency engineering to represent complex load impedances and admittances together with their complex
voltage reflection coefficients. Consider
a voltage wave on a transmission line with real positive characteristic impedance
 . If
. If  is the complex amplitude of the wave incident on a load
 and
and  is the complex amplitude of the wave reflected by the load,
then the voltage reflection coefficient
at the load is
is the complex amplitude of the wave reflected by the load,
then the voltage reflection coefficient
at the load is  .
Its complex modulus is the reflected-to-incident
voltage-amplitude ratio, its complex argument
is the phase shift on reflection, and, for a lossless line,
.
Its complex modulus is the reflected-to-incident
voltage-amplitude ratio, its complex argument
is the phase shift on reflection, and, for a lossless line,  is the reflected-to-incident power ratio (Pozar 2012).
Define the normalized load impedance  . The Möbius
transformation
. The Möbius
transformation
 |
maps  to its complex reflection
coefficient
to its complex reflection
coefficient  ,
with inverse
,
with inverse
 |
Because passive loads satisfy  , this conformal mapping
sends their half-plane to the closed unit
disk
, this conformal mapping
sends their half-plane to the closed unit
disk  .
The matched load
.
The matched load  maps to the center
  ,
a short circuit
,
a short circuit  maps to
  ,
and an open circuit corresponds to
,
and an open circuit corresponds to  .
.
Writing  ,
curves of constant resistance
,
curves of constant resistance  and constant reactance
  become two families of circles
in the
become two families of circles
in the  -plane.
These circles form the characteristic grid of the Smith chart and permit graphical
calculations for impedance matching and transmission lines (Smith 1939).
-plane.
These circles form the characteristic grid of the Smith chart and permit graphical
calculations for impedance matching and transmission lines (Smith 1939).
A Smith chart and a Nyquist plot can both display a complex-valued frequency locus, but they answer different questions. The Smith
chart applies a fixed Möbius transformation
to impedance and emphasizes matching and reflection, whereas the Nyquist
plot uses the contour winding number
about  to determine feedback stability.
