

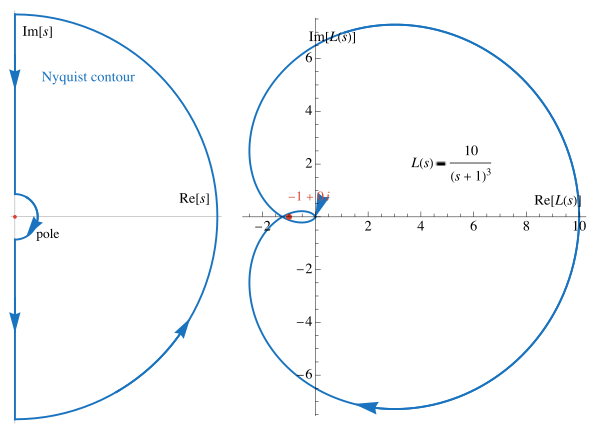
The Nyquist plot of a transfer function  is the image curve
  in the complex plane
as
in the complex plane
as  traverses a Nyquist
contour
traverses a Nyquist
contour  .
The part obtained from
.
The part obtained from  records the frequency response as the real
frequency
records the frequency response as the real
frequency  varies. The full plot also includes the images of the closing
arc and of any small indentations around poles
on the imaginary axis. The Nyquist
criterion reads the winding number of
this plot about the critical point
varies. The full plot also includes the images of the closing
arc and of any small indentations around poles
on the imaginary axis. The Nyquist
criterion reads the winding number of
this plot about the critical point  . Equivalently, the image curve is the oriented set of complex
numbers traced by
. Equivalently, the image curve is the oriented set of complex
numbers traced by  as
as  moves around
  . The point
  is critical because
  makes the closed-loop characteristic function
  vanish.
Like a Smith chart, a Nyquist plot traces a complex-valued frequency response. A Nyquist plot is used
to infer feedback stability from winding around  , whereas a Smith chart
maps normalized impedance to a reflection coefficient
and is used primarily for impedance matching.
, whereas a Smith chart
maps normalized impedance to a reflection coefficient
and is used primarily for impedance matching.
