


The utility graph is the complete bipartite graph  .
The utility problem posits three houses and three utility companies--say, gas, electricity,
and water--and asks if each utility can be connected to each house without having
any of the gas/water/electric lines/pipes pass over any other. This is equivalent
to the question "Can a planar graph be constructed
from each of three nodes ('houses') to each of three
other nodes ('utilities')?" This problem was
first posed in this form by H. E. Dudeney (1917, cited by Gardner 1984,
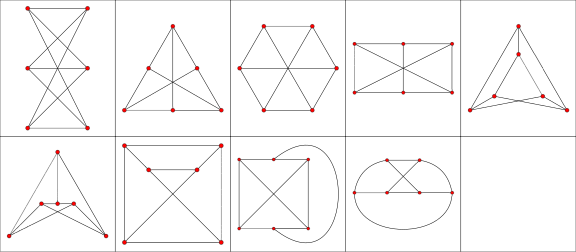
p. 92). The utility graph is illustrated above in a number of drawings.
.
The utility problem posits three houses and three utility companies--say, gas, electricity,
and water--and asks if each utility can be connected to each house without having
any of the gas/water/electric lines/pipes pass over any other. This is equivalent
to the question "Can a planar graph be constructed
from each of three nodes ('houses') to each of three
other nodes ('utilities')?" This problem was
first posed in this form by H. E. Dudeney (1917, cited by Gardner 1984,
p. 92). The utility graph is illustrated above in a number of drawings.
The answer is that no such planar graph exists, and the proof can be effected using the Jordan curve
theorem, while a more general result encompassing this one is Kuratowski's
theorem. The utility graph is the graph showing the
relationships described above, also known as the Thomsen graph (e.g., Coxeter 1950)
and, in the more formal parlance of graph theory,
is known as the complete bipartite graph  (and is also equivalent to the
circulant graph
(and is also equivalent to the
circulant graph  ).
).
It is implemented in the Wolfram Language as GraphData["UtilityGraph"].
The utility graph has graph crossing number 1, with a minimal crossing drawing illustrated as the rightmost figure above.
A simple proof of the nonplanarity of the utility graph can be effected by noting that the graph consists of a graph
cycle  ,
to which the three edges
,
to which the three edges  ,
,  ,
and
,
and  must be added. Now, for each of the
edges, we have to choose whether to draw the edge
inside or outside the graph cycle, and so for two
of the edges, we must make the same choice. But two
lines can't be drawn on the same side without crossing, hence the graph
is nonplanar.
must be added. Now, for each of the
edges, we have to choose whether to draw the edge
inside or outside the graph cycle, and so for two
of the edges, we must make the same choice. But two
lines can't be drawn on the same side without crossing, hence the graph
is nonplanar.
It can be represented using LCF notation as ![[-3,3]^3](/images/equations/UtilityGraph/Inline8.svg) . The utility graph is an integral
graph with graph spectrum
. The utility graph is an integral
graph with graph spectrum  .
.
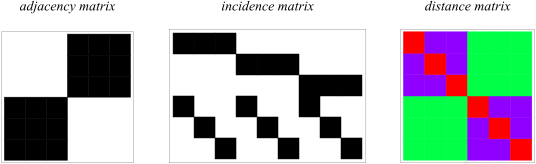
The plots above show the adjacency matrix, incidence matrix, and graph distance matrices for the utility graph.
Excising an edge of the utility graph gives the tetrahedral graph.
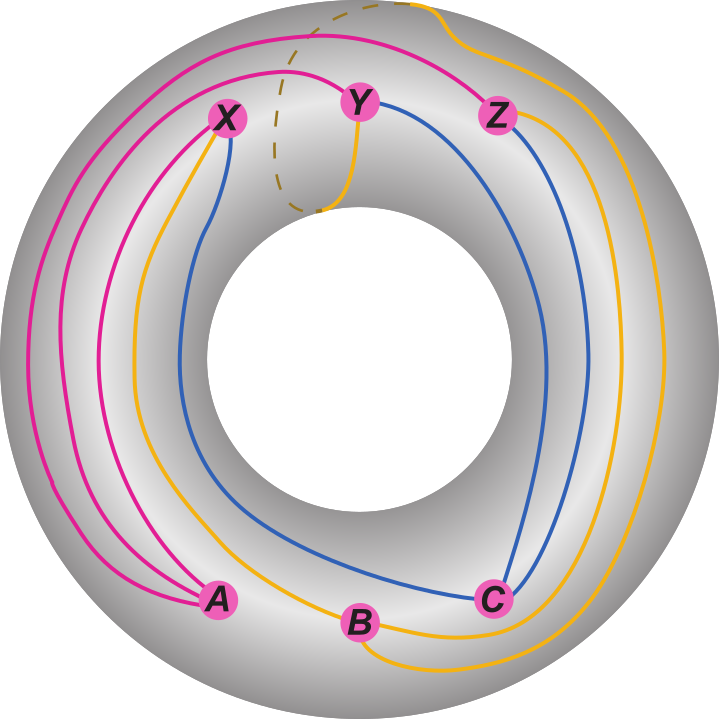
The utility graph has graph genus  and so it can be drawn on a torus
with no crossings (i.e., it is a toroidal graph),
as illustrated above (M. Malak, pers. comm., Feb. 15, 2006).
and so it can be drawn on a torus
with no crossings (i.e., it is a toroidal graph),
as illustrated above (M. Malak, pers. comm., Feb. 15, 2006).
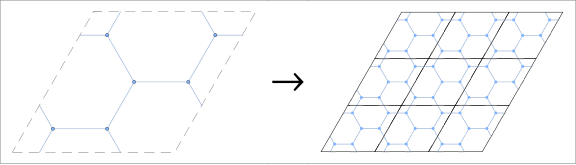
The left-hand drawing above shows an embedding in a fundamental region whose paired boundary sides are identified to form a torus. The right-hand drawing shows a finite patch of the corresponding periodic lift, illustrating how edges continue across these boundaries and where corresponding vertices in different regions represent the same vertex on the torus.
The utility graph is an outer-cylindrical forbidden minor No. 1 (Archdeacon et al. 2001).

 ."
."