


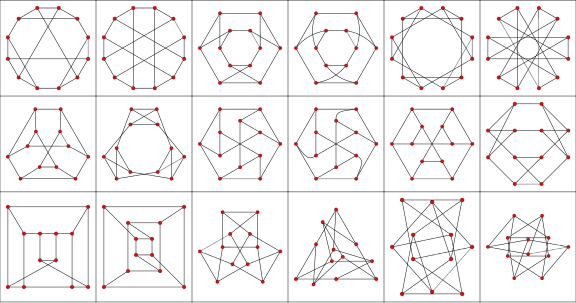
The Franklin graph is the cubic graph with 12 vertices shown above in a number of drawings in the plane. Its embedding on the Klein bottle gives a map requiring six colors. Franklin (1934) proved that six colors suffice for every map on the Klein bottle, whereas the Heawood conjecture predicts seven. The Klein bottle is the sole exceptional surface.
The Franklin graph is implemented in the Wolfram Language as GraphData["FranklinGraph"].
It is isomorphic to the 6-crossed prism graph, Knödel graph  , and honeycomb
toroidal graph
, and honeycomb
toroidal graph  .
The Franklin graph is also its own graph distance
graph with distance 3.
.
The Franklin graph is also its own graph distance
graph with distance 3.
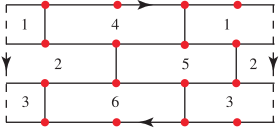
A graph coloring of the Franklin graph using the fewest colors for its vertices is illustrated above.
The Franklin graph is nonplanar but Hamiltonian. It has LCF notations ![[5,-5]^6](/images/equations/FranklinGraph/Inline3.svg) and
and ![[-5,-3,3,5]^3](/images/equations/FranklinGraph/Inline4.svg) . The graph spectrum
of the Franklin graph is
. The graph spectrum
of the Franklin graph is  .
.
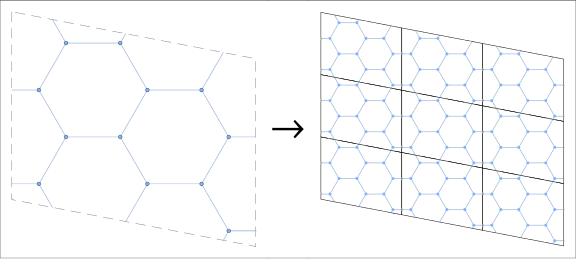
The Franklin graph is a toroidal graph, as illustrated above. The left-hand drawing shows an embedding in a fundamental region whose paired boundary sides are identified to form a torus. The right-hand drawing shows a finite patch of the corresponding periodic lift, illustrating how edges continue across these boundaries and where corresponding vertices in different regions represent the same vertex on the torus.
