


A semilog plot, also called a single-log plot, uses a logarithmic scale on one axis and a linear scale on the other. On a plot with a logarithmic vertical axis, an exponential function  with
with  appears as the line
 |
On a plot with a logarithmic horizontal axis, a function of the form  appears linear. Thus semilog plots are useful for recognizing
dependence described by an exponential function
or logarithm and for comparing quantities spanning
many orders of magnitude.
appears linear. Thus semilog plots are useful for recognizing
dependence described by an exponential function
or logarithm and for comparing quantities spanning
many orders of magnitude.
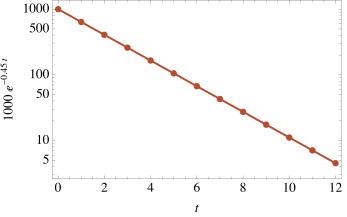
The exponential decay data  form a straight line on the semilog plot above.
In the Wolfram Language, plots with logarithmic vertical and horizontal axes are produced by LogPlot[f,
 x, xmin, xmax
 ] and LogLinearPlot[f,
 x, xmin, xmax
 ], respectively. The corresponding functions
for lists of data are ListLogPlot[list]
and ListLogLinearPlot[list].
], respectively. The corresponding functions
for lists of data are ListLogPlot[list]
and ListLogLinearPlot[list].
