


A log-log plot displays positive coordinates  using logarithmic scales on both axes. Any fixed logarithm
base may be used without changing whether the plotted points are collinear
or changing the fitted power-law exponent. Base 10 is traditional and common for
labeled axes, while natural logarithms are often
convenient in formulas. A power law
using logarithmic scales on both axes. Any fixed logarithm
base may be used without changing whether the plotted points are collinear
or changing the fitted power-law exponent. Base 10 is traditional and common for
labeled axes, while natural logarithms are often
convenient in formulas. A power law  appears as the line
 |
whose slope is  . Straightness on a log-log plot is therefore useful for diagnosing
power-law behavior, although it does not by itself establish a power-law model.
. Straightness on a log-log plot is therefore useful for diagnosing
power-law behavior, although it does not by itself establish a power-law model.
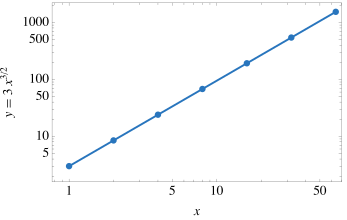
The power-law data  form a straight line on the log-log plot above.
The Wolfram Language functions LogLogPlot[f,
 x, xmin, xmax
 ] and ListLogLogPlot[data]
produce log-log plots of functions and data, respectively.
] and ListLogLogPlot[data]
produce log-log plots of functions and data, respectively.
