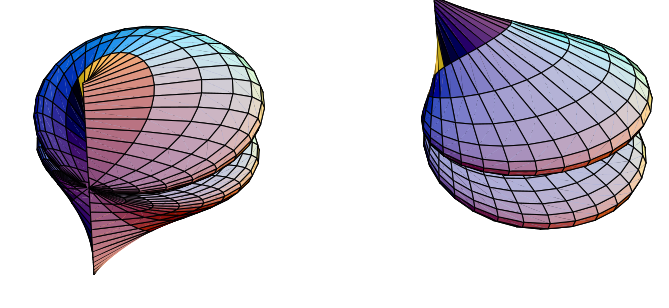
A plot of a function expressed in spherical coordinates, with radius  as a function of angles
  and
and  . Polar plots can be drawn using SphericalPlot3D[r,
 phi, phimin, phimax
 ,
,  theta, thetamin, thetamax
 ]. The plots above are spherical plots of the equations
 ![r=R[sin(theta+iphi)]](/images/equations/SphericalPlot/Inline8.svg) and
and ![r=I[sin(theta+iphi)]](/images/equations/SphericalPlot/Inline9.svg) , where
, where ![R[z]](/images/equations/SphericalPlot/Inline10.svg) denotes the real part and
denotes the real part and
![I[z]](/images/equations/SphericalPlot/Inline11.svg) the imaginary
part. The spherical plot of a constant
the imaginary
part. The spherical plot of a constant  is a sphere of radius
  .
.