TOPICS
Search

Spectral Portrait


A spectral portrait is a contour plot or color rendering that visualizes the sensitivity of matrix eigenvalues to perturbations. For a nonzero square matrix A, one relative-perturbation convention plots over the complex plane

 s(z)=log_(10)[||A||_2||(zI-A)^(-1)||_2],

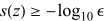
where ||·||_2 is the spectral norm. The function diverges at the eigenvalues of A. The region s(z)>=-log_(10)epsilon, including these eigenvalues, is the relative epsilon-pseudospectrum, where epsilon>0, corresponding to complex perturbations E with ||E||_2<=epsilon||A||_2 (McCoy et al. ). Equivalently, away from the eigenvalues,

 s(z)=log_(10)||A||_2-log_(10)sigma_(min)(zI-A),

where sigma_(min) is the smallest singular value.


See also

Pseudospectrum

Explore with Wolfram|Alpha

References

McCoy, A.; Toumazou, V.; and Fraysse, V. "Spectral Portraits." NIST Matrix Market. https://math.nist.gov/MatrixMarket/spectral.html.Trefethen, L. N. and Embree, M. Spectra and Pseudospectra: The Behavior of Nonnormal Matrices and Operators. Princeton, NJ: Princeton University Press, 2005.

Cite this as:

Weisstein, Eric W. "Spectral Portrait." From MathWorld--A Wolfram Resource. https://mathworld.wolfram.com/SpectralPortrait.html

Subject classifications