


A parametric plot displays the image traced by parametric equations as their parameter varies over a specified interval. A plane parametric plot has the form
 |
while three component functions define a space curve. Unlike the graph of a single-valued function  , a parametric plot may double back,
have vertical tangents, or pass through the same
point for different parameter values.
, a parametric plot may double back,
have vertical tangents, or pass through the same
point for different parameter values.
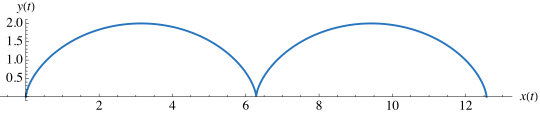
The cycloid parametrized by  and
and  is illustrated above.
The Wolfram Language function ParametricPlot[ fx, fy
 ,
,  t,
tmin, tmax
t,
tmin, tmax ]
plots a plane parametrized curve, while ParametricPlot3D[
]
plots a plane parametrized curve, while ParametricPlot3D[ fx, fy, fz
 ,
,  t, tmin, tmax
 ] plots a space curve.
