

A normal probability plot is a quantile-quantile plot that compares ordered observations with corresponding quantiles of a normal distribution. If 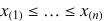 are the order
statistics, typical plotting points pair
are the order
statistics, typical plotting points pair  with
with
![z_i=Phi^(-1)[(i-a)/(n+1-2a)],](/images/equations/NormalProbabilityPlot/NumberedEquation1.svg) |
where  is the standard normal quantile function and
the constant
is the standard normal quantile function and
the constant  specifies a plotting-position convention.
Data from a normal distribution should lie approximately on a line. Curvature, tail departures, and isolated points can indicate skewness, heavy or light tails, or outliers, but the visual judgment depends on sample size and should not be treated as a proof of normality.
