


A heat map is a visualization of a rectangular array of values in which each array element is represented by a color chosen from a scale. The rows and columns often correspond to variables or observations, so a heat map provides a color-coded view of a matrix without printing every numerical entry.
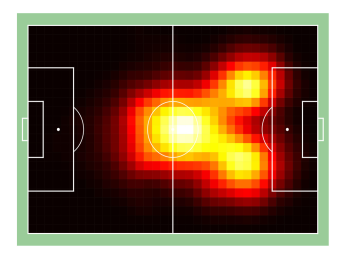
A heat map can also display spatial data by dividing a region into cells and coloring each cell according to a measured or computed value. For example, a soccer player's locations over the course of a match, obtained either from tagged events or from a tracking system, can be binned across the field to show where the player was most frequently located (Garrido et al. 2022).
The illustration above was generated from deterministic synthetic player positions. Brighter colors indicate regions with larger smoothed bin counts.
A cluster heat map reorders rows and columns using cluster analysis and commonly displays the resulting cluster trees beside the array. The colors then reveal blocks of relatively large or small values and other patterns aligned with the clustering (Wilkinson and Friendly 2009).
