


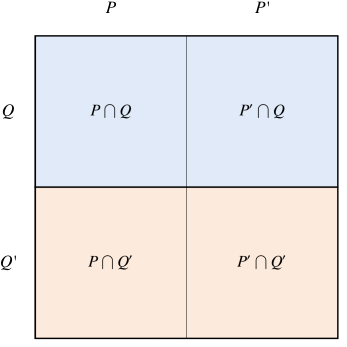
A Carroll diagram is a table used to classify the members of a set according to two or more properties. For two properties, let  and
and  denote subsets of an ambient set whose elements have the respective properties. The four
cells then contain the elements in
denote subsets of an ambient set whose elements have the respective properties. The four
cells then contain the elements in  ,
,  ,
,  , and
, and  , respectively, where the primes denote
set complements. Carroll diagrams are named for
Lewis Carroll, who used such tables in symbolic logic (Carroll 1972).
, respectively, where the primes denote
set complements. Carroll diagrams are named for
Lewis Carroll, who used such tables in symbolic logic (Carroll 1972).
