


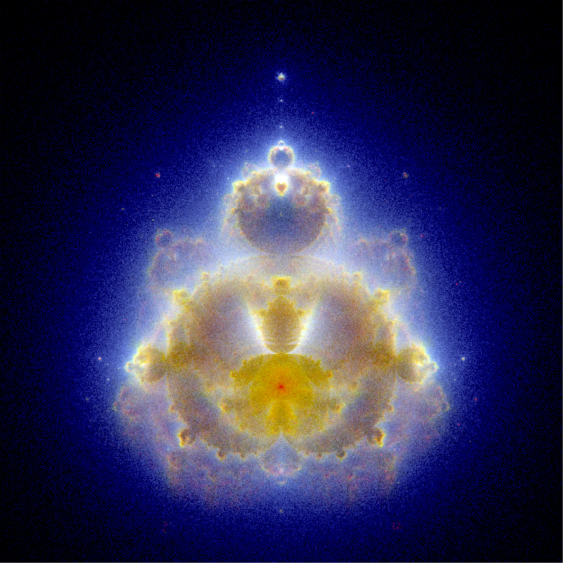
The Buddhabrot is an orbit-density rendering of the Mandelbrot set. Rather than being a distinct fractal set, it records the positions visited by escaping map orbits of the quadratic map.
Beginning with  ,
choose sampled values of a complex parameter
,
choose sampled values of a complex parameter  in a region of the complex plane
and iterate
in a region of the complex plane
and iterate
 |
For a fixed maximum number of iterations and escape radius, ignore samples whose iterates do not cross the escape radius before the iteration
limit. For every remaining sample, increment the histogram bin containing each visited value of  before escape. The displayed intensity of a bin is an increasing
function of its count, so bright regions are those visited
more often by escaping map orbits (Bourke 2000, Munafo
2023).
before escape. The displayed intensity of a bin is an increasing
function of its count, so bright regions are those visited
more often by escaping map orbits (Bourke 2000, Munafo
2023).
Green reports developing the technique in 1993 and credits computer artist Lori Gardi with the name. The usual rendering is rotated 90 degrees from the conventional orientation of the Mandelbrot set. Its shape then resembles images of a seated Buddha (Munafo 2023). The illustration above uses a false-color scheme in which the red, green, and blue channels have maximum iteration counts 5000, 500, and 50, respectively (Roger 2017).

.png)