


A histogram is a graphical representation of data grouped into intervals called bins. The rectangles span the bins, with areas proportional to the numbers of observations they contain. For equal-width bins, the heights may be taken as the numbers of observations. Adjacent nonempty bins conventionally have touching rectangles, while an empty bin has height 0.
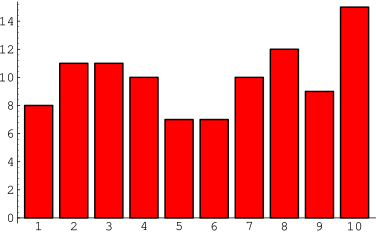
The histogram illustrated above shows the number of variates in bins with class interval 1 for a sample of 100 real variates with a uniform distribution between 0 and 10. Therefore, bin 1 gives the number of variates in the range 0-1, bin 2 gives the number of variates in the range 1-2, etc.

For the histogram illustrated above, the bin boundaries are 0, 1, 3, 4, and 6, and the numbers of observations are 4, 6, 2, and 8, respectively. The heights are therefore 4, 3, 2, and 4, so that the rectangle areas equal the corresponding numbers of observations.
Histograms are implemented in the Wolfram Language as Histogram[data].
