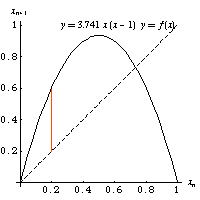
A web diagram, also called a cobweb plot, is a graph that can be used to visualize successive iterations of a function  . In particular, the segments of the diagram connect the
points
. In particular, the segments of the diagram connect the
points  ,
,
 ,
,  , .... The diagram is so-named because its
straight line segments "anchored" to the functions
, .... The diagram is so-named because its
straight line segments "anchored" to the functions  and
and  can resemble a spider web. The animation above shows
a web diagram for the logistic map
can resemble a spider web. The animation above shows
a web diagram for the logistic map  with
with  .
.