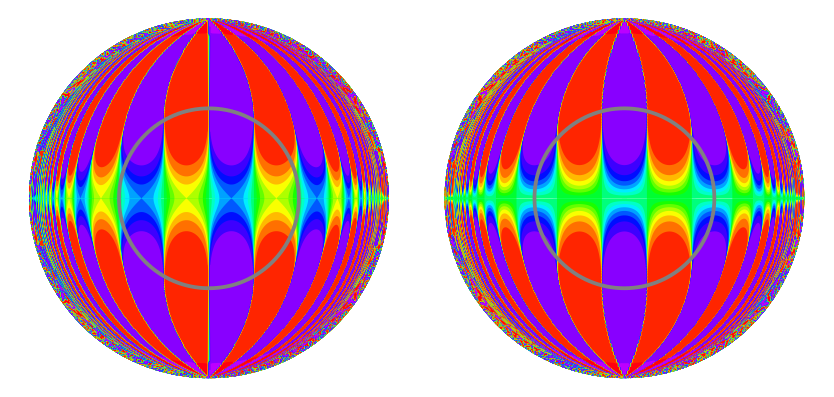
A type of plot invented by M. Trott that shows the behavior of a function near and far from the origin simultaneously. Inside a given
radius, the plot shows the actual value of the function, which outside the radius,
the circle becomes an inversion circle and the
plot shows the inversion of the function. The plots
above are inside-outside plots for the real and imaginary parts of  with the inversion circle
(indicated in gray) taken to have radius
with the inversion circle
(indicated in gray) taken to have radius  .
.