

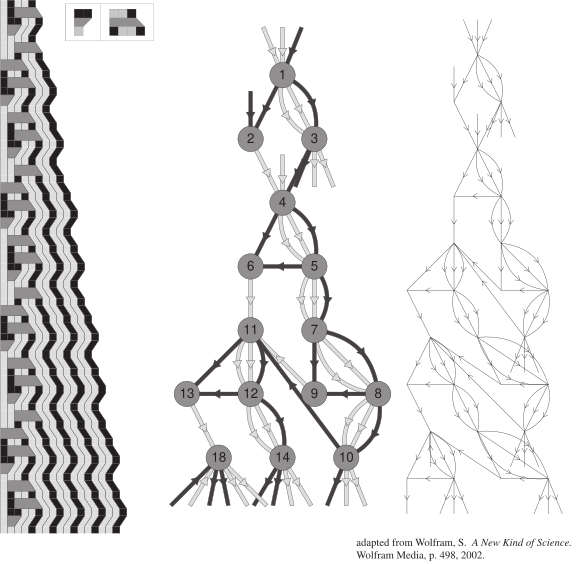
A causal graph (or causal network) is an acyclic digraph arising from an evolution of a substitution system
(Wolfram 2002, pp. 486-524)
or other update system (Wolfram). The nodes of a
causal graph represent updating events and its edges
represent their causal relationships (Wolfram). The graph
itself therefore represents the history of the system. The illustration above shows
a causal network corresponding to the rules  (applied in a left-to-right scan) and
initial condition
 (Wolfram 2002, p. 498,
fig. a).
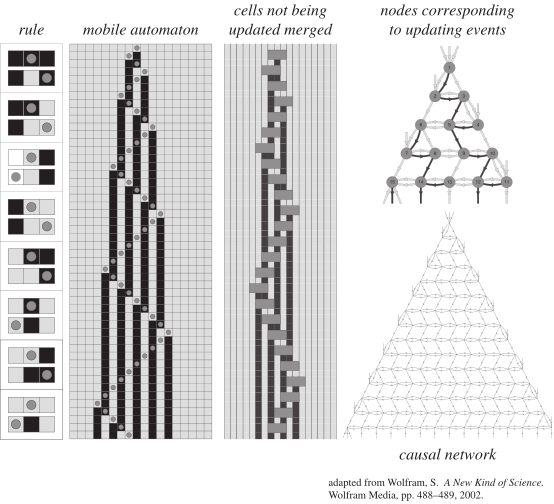
The figure above shows the procedure for diagrammatically creating a causal graph from a mobile automaton (Wolfram 2002, pp. 488-489).
In an evolution of a multiway system, each substitution event is a vertex in a causal graph. Two events which are related by causal dependence, meaning the latter uses output produced by the former, have an edge between the corresponding vertices in the causal graph. More precisely, the edge is a directed edge leading from the past event to the future event.
Some causal graphs are independent of the choice of evolution, and these are called causally invariant.
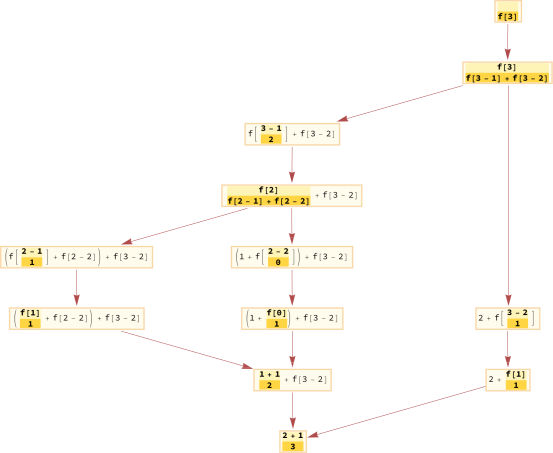
Wolfram (2023) considers multicomputation using causal graphs. For example, the illustration above depicts the causal graph obtained
by computing the Fibonacci number  using the shifted indexing convention
 and
 . Thus the illustrated computation
is
 , where
 for the standard Fibonacci
numbers
 ,
 . While all the events (or subevaluations)
in any timelike chain must be done in sequence, spacelike-separated
events (or subevaluations) don't immediately have a particular relative order. The
whole graph can therefore be thought of as defining a partial ordering for all
events (Wolfram 2023).

 Gorard, J. and Piskunov, M. "CausalConnectionGraph:
Generate a Graph Giving the Relations between Regions of Causally Equivalent Events
in a Causal Graph."