
A schematic diagram used in logic theory to depict collections of sets and represent their relationships.
The Venn diagrams on two and three sets are illustrated above. The order-two diagram (left) consists of two intersecting circles, producing
a total of four regions,  ,
,
 ,
,  , and
, and  (the empty set, represented
by none of the regions occupied). Here,
(the empty set, represented
by none of the regions occupied). Here,  denotes the intersection
of sets
denotes the intersection
of sets  and
and  .
.
The order-three diagram (right) consists of three symmetrically placed mutually intersecting circles comprising
a total of eight regions. The regions labeled  ,
,  ,
and
,
and  consist of members which are only in
one set and no others, the three regions labelled
consist of members which are only in
one set and no others, the three regions labelled  ,
,  , and
, and  consist of members which are in two sets but
not the third, the region
consist of members which are in two sets but
not the third, the region  consists of members which are simultaneously in all three, and no regions occupied
represents
consists of members which are simultaneously in all three, and no regions occupied
represents  .
.
In general, an order- Venn diagram is a collection of
  simple closed curves in the plane
such that
simple closed curves in the plane
such that
1. The curves partition the plane into  connected regions, and
2. Each subset  of
of  corresponds to a unique region formed by the intersection of the interiors of the
curves in
corresponds to a unique region formed by the intersection of the interiors of the
curves in  (Ruskey).
Since there are  (the binomial coefficient) ways to pick
  members from a total of
  , the number of regions in an order
  Venn diagram is
 |
(where the region outside the diagram is included in the count).
The region of intersection of the three circles  in the
order three Venn diagram in the special case of the center of each being located
at the intersection of the other two is a geometric
shape known as a Reuleaux triangle.
in the
order three Venn diagram in the special case of the center of each being located
at the intersection of the other two is a geometric
shape known as a Reuleaux triangle.
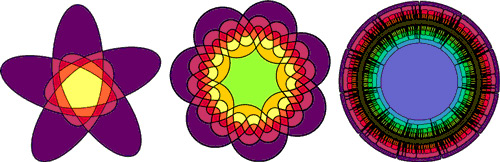
The left figure at left above shows an  Venn diagram due to Branko Grünbaum, while the attractive
7-fold rosette illustrated in the middle figure is an
Venn diagram due to Branko Grünbaum, while the attractive
7-fold rosette illustrated in the middle figure is an  Venn diagram called "Victoria" by Ruskey. The
right figure shows a recently constructed symmetric Venn diagram on
Venn diagram called "Victoria" by Ruskey. The
right figure shows a recently constructed symmetric Venn diagram on  due to Ruskey, Carla Savage, and Stan Wagon.
In Season 4 episode "Power" of the television crime drama NUMB3RS, mathematical genius Charles Eppes constructs a Venn diagram to determine suspects who match a particular description and have a history of violence.